Read X and the City: Modeling Aspects of Urban Life Online
Authors: John A. Adam
X and the City: Modeling Aspects of Urban Life (5 page)

Alternatively,
what is the probability of being killed in a car accident?
The average life span of people in the U.S. is about 75 years, neglecting gender differences, so 1 in 75 Americans dies every year. Hence the average number of deaths per year is 3 × 10
8
÷ 75, that is, 4 × 10
6
deaths/yr, so the total (lifetime) probability of dying in a car crash is 4 × 10
4
deaths/yr ÷ 4 × 10
6
deaths/yr = 0.01, or 1%. It is therefore pretty safe to say that if you are reading this book, and are not a babe-in-arms, then your “probability” is rather less than this!
Question:
What is the risk of dying per mile while flying? [
7
]
Most of us travel by air once a year (2 flights) on vacation or business, and a small fraction of the population travel much more than that. We’ll use an average of 3 flights/person, so that’s 10
9
people-flights per year; the actual figure in 2005 was 6.6 × 10
8
, so we’ll use the slightly more accurate value of 7 × 10
8
flights/yr. The average (intracontinental) flight distance probably exceeds 300 miles (or it would be simpler to drive) but is less than 3000 miles; the geometric mean is 10
3
miles, so we travel about 7 × 10
11
mi/yr by air.
The crash frequency of large planes is (fortunately) less than one per year and (unfortunately) more than one per decade, so the geometric mean gives
about one third per year. Typically, about 100 to 200 people die in each (large) crash; we’ll take about 50 deaths/yr, so the per-mile probability of dying is, on the basis of these crude estimates, about 50 ÷ 7 × 10
11
≈ 7 × 10
−11
deaths/mile, some 300 times safer than driving! Of course, this is overly simplistic since most crashes occur at take-off or landing, but it does remind us how safe air travel really is.
While on this subject, I recall hearing of a conversation about the risks of flying that went something like this:
“You know, the chances of dying on a flight are really very small. You’re much more likely to die on the roads! And anyway, when it’s your time to go, it’s your time to go!’
“But what if it’s the pilot’s time to go and not mine?”
1
This, by the way, is using the
Goldilocks principle
—is it too large, too small, or just right? The geometric mean helps us find “just right,” often to within a factor of two or three, which is very useful when dealing with several orders of magnitude. Under these circumstances it is far more valuable than the arithmetic mean, though in this particular example the two give essentially the same answer. We shall encounter the need for this useful principle time and again in this book.
LIVING IN THE CITY

=
N
: A “ONE-FITS-MANY” CITY “BALLPARK” ESTIMATE
Suppose the city population is
N
p
million, and we wish to estimate
N
, the number of facilities, (dental offices, gas stations, restaurants, movie theaters, places of worship, etc.) in a city of that size. Furthermore, suppose that the average “rate per person” (visits per year, or per week, depending on context) is
R
, and that the facility is open on average
H
hours/day and caters for an average of
C
customers per hour. We shall also suppose there are
D
days per year. This may seem a little surprising at first sight: surely
everyone
knows that
D
= 365 when the year is not a leap year! But since we are only “guesstimating” here, it is convenient to take
D
to be 300. Note that 400 would work just as well—remember that we are not concerned here about being a “mere” factor of two or three out in our estimate.
Then the following ultimately dimensionless expression forms the basis for our specific calculations:
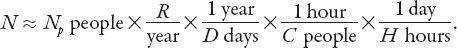
For simplicity, let’s consider a city population of one million. How many dental offices might there be? Most people who visit the dentist regularly do so twice a year, some visit irregularly or not at all, so we shall take
R
= 1,
C
= 5,
H
= 8 and
D
= 300 (most such offices are not open at weekends) to obtain

That is, to the nearest order of magnitude, about a hundred offices. A similar estimate would apply to doctors’ offices.
Let’s now do this for restaurants and fast-food establishments. Many people eat out every working day, some only once per week, and of course, some not at all. We’ll use
R
= 2 per week (100 per year), but feel free to replace my numbers with yours at any time. The size of the establishment will vary, naturally, and a nice leisurely dinner will take longer than a lunchtime hamburger at a local “McWhatsit’s” fast-food chain, so I’ll pick
C
= 50, allowing for the fast turn-around time at the latter. Hours of operation vary from pretty much all day and night to perhaps just a few hours in the evening; I’ll set an average of
H
= 10. Combining everything as before, with
D
equal to 400 now (such establishments are definitely open on weekends!), we find for the same size city

Therefore the most we can say is that there are probably several hundred places to eat out in this city! I’m getting hungry . . .
We can do this for the number of gas stations, movie theaters, and any other facility you wish to estimate.
Exercise:
Make up your own examples. Do your answers make sense?
Our final example will be to estimate the number of houses of worship in the city. Although many, if not most, have midweek meetings in addition to
the main one at the end of the week or at some time during the weekend, I shall use the figure for
R
of 50 per year (or once per week) as above in the “eating out” problem. Spiritual food for those that seek it! But now I shall include the proportion of people who attend houses of worship in the calculation because clearly not everyone does. In the U.S. this is probably a higher proportion than in Europe, for example, so I shall suggest that one in five attend once per week in the U.S. The estimates for
C
and
H
are irrelevant (and meaningless) in this context, since everyone who attends regularly knows when the services start! Furthermore, this is more of a “discrete” problem since the vast majority of those who attend a house of worship do so once a week, so we shall simplify the formula by estimating an average attendance for the service. From my own experience, some churches have a very small attendance and some are “mega-churches,” and I will assume that the range is similar for other faith traditions also. Using the Goldilocks principle—too small, too large, or just right?—I shall take the geometric mean of small attendance (10) and large attendance (1000), that is, 100. Hence the approximate number of houses of worship in a city of one million people is

=
d
: THE MUSEUM
Question:
What is the optimal distance from which to view a painting/sculpture/display?
At the outset, it should be pointed out that we are referring to an object for which the lowest point is above the eye level of the observer: a painting high on a wall, a sculpture or statue on a plinth, and so forth. Commonsense indicates that unless this is the case, the angle subtended by the statue (say) at the observer’s eye will increase as the statue is approached. Of course, there is still an optimal viewing distance—wherever the observer feels most comfortable standing or sitting—but this is subjective. What this question means is where is the maximum angle subtended when the base or bottom of the painting is above the ground? That a maximum must occur is again obvious—far away that angle is very small, and close up it is also small, so a maximum must occur somewhere between those positions.